Users
Put a name to the traffic. Once you call amb('setUser', ...), this dashboard shows the
identified people behind your sessions alongside the anonymous visitors, so you can find a specific
customer and replay their whole journey.
Most dashboards aggregate across everyone. Users goes the other way: it lets you drill into one account, see what they did, what it was worth, and where they were. See Identify users for how to attach an id.
What it answers #
- How many of my visitors are identified versus anonymous?
- Who are my most active users, and what are they worth?
- What did one specific customer do and experience?
- How many new users showed up this period?
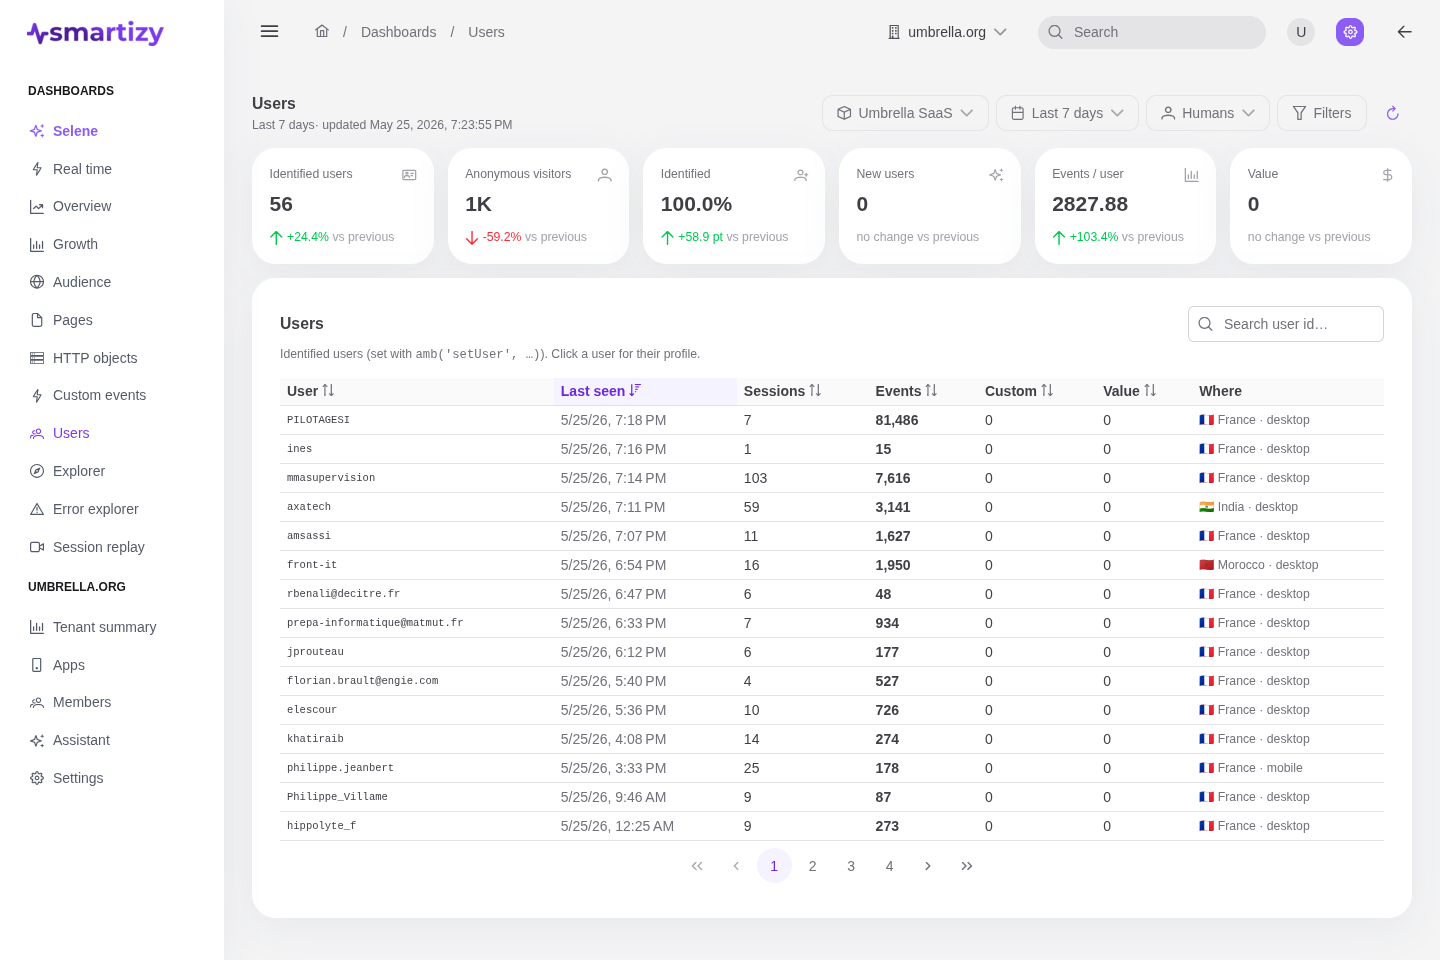
What you see #
The dashboard reads the app, period, audience, and filters from the scope bar. The KPI strip leads with who your audience is, each metric compared to the preceding equal-length window:
- Identified users, the distinct people you named with
setUser. - Anonymous visitors, the people behind an anonymous id who have not been identified.
- Identified %, the share of your audience you can put a name to.
- New users, identified users seen for the first time this period.
- Events / user, the average activity per identified user.
- Value, the custom-event value attributed to identified users.
The users table #
The table lists each identified user, newest-active first, and is searchable and sortable. Type part of a user id into the search box to find one customer fast, the "look up this account" entry point.
| Column | What it tells you |
|---|---|
| User | The id you passed to setUser. |
| Last seen | When they were most recently active. |
| Sessions | How many sessions they ran in the period. |
| Events | Their total captured events. |
| Custom events | The owner-defined events they fired. |
| Value | The custom-event value attributed to them. |
| Where | Their most-recent country and device. |
Profile and journey #
Click a row to open the per-user profile. It pulls together their identity (most-recent geography and device), their period totals (sessions, events, page views, custom events, errors, and value), and their top custom events. Below it, an activity journey lists their page visits newest-first, so you can trace exactly where a customer went. Page views only, so technical telemetry never crowds out the story.
Worked example #
A support agent gets a ticket: a customer says the upgrade flow is broken. The agent opens Users, searches the customer's account id, and opens their profile. The journey shows they reached the pricing page three times but never the confirmation page, and the totals show an error on each visit. Cross-referencing the Error explorer confirms the bug. The agent replies with a fix ETA instead of asking the customer to reproduce it.