Session replay
Watch a reconstruction of a real session to see exactly what a user experienced. When a metric or an error leaves you guessing, replay turns the numbers back into a story: the clicks, the scrolls, the moment something went wrong.
Replay records the structure of the page and the user's interactions, then plays them back like a video. It is the fastest way to understand a confusing bug report or to see why a flow stalls, no reproduction steps required.
What it answers #
- What did this user actually do before they hit an error?
- Where do users get stuck or hesitate in a flow?
- Why does a session run unusually long?
- What did a confusing support ticket really look like?
What you see #
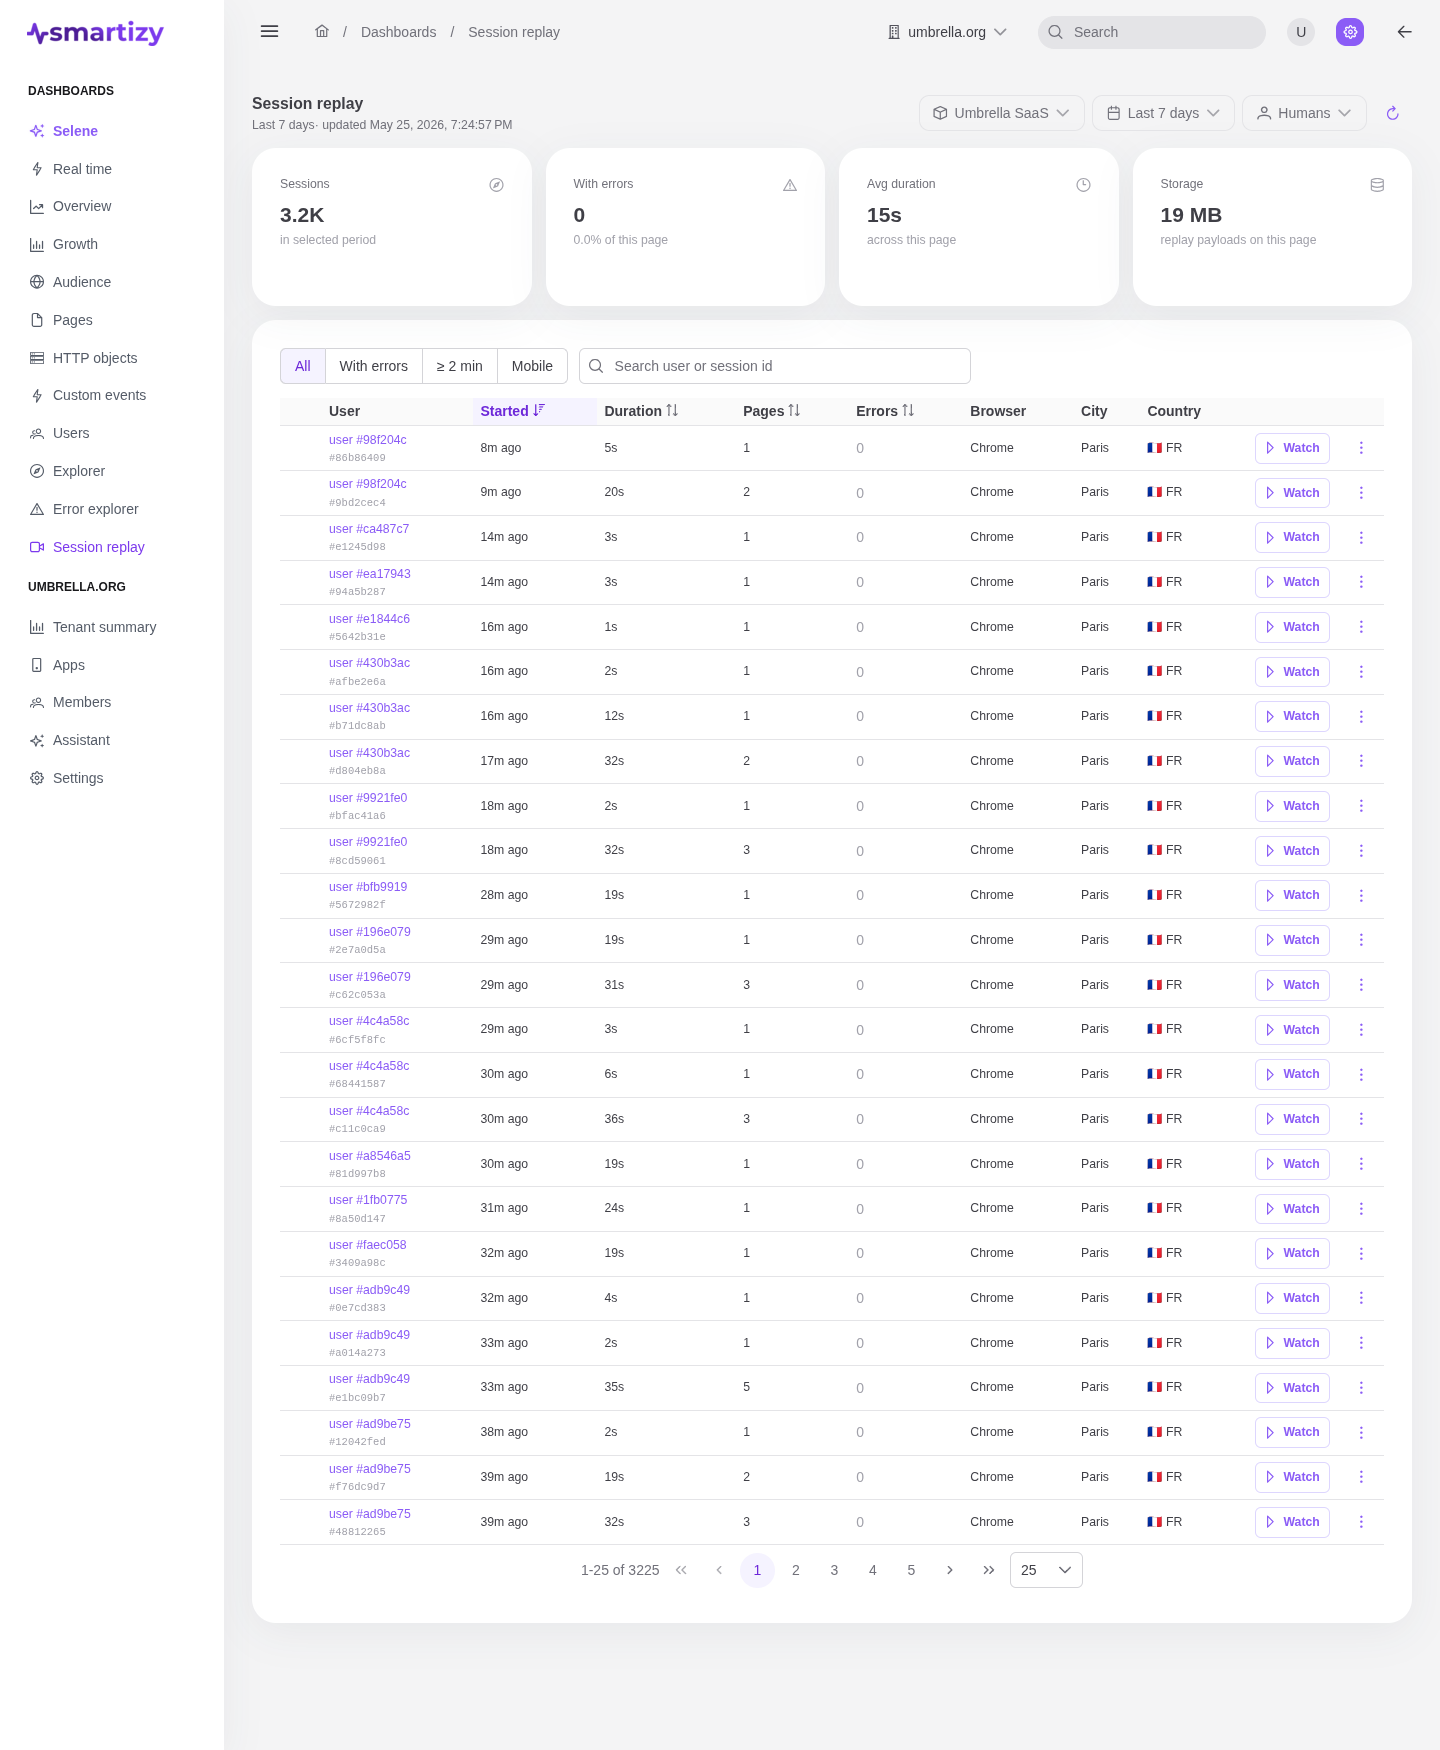
The dashboard reads the app and period from the scope bar. The KPI strip summarises the period:
- Events, the captured activity behind the recordings.
- Avg duration, the average length of a recorded session.
- Replay size, the total stored bytes, so you can keep an eye on storage.
Quick filters narrow the list to the sessions worth watching: sessions with errors, long sessions, or mobile sessions.
The sessions table #
The table lists recorded sessions, each with the context you need to pick the right one to watch:
| Column | What it tells you |
|---|---|
| User | The identified user, or anonymous. |
| Started | When the session began. |
| Duration | How long it ran. |
| Pages | How many pages the user visited. |
| Errors | How many errors fired, the rows worth watching first. |
| Browser | The browser used. |
| City / Country | Where the session came from. |
The player #
Open a row to launch the player. It replays the session with a timeline you can scrub, and the timeline carries markers for key moments: navigations between pages and errors. Jump straight to an error marker to see what the user did in the seconds before it, instead of watching the whole session.