Explorer
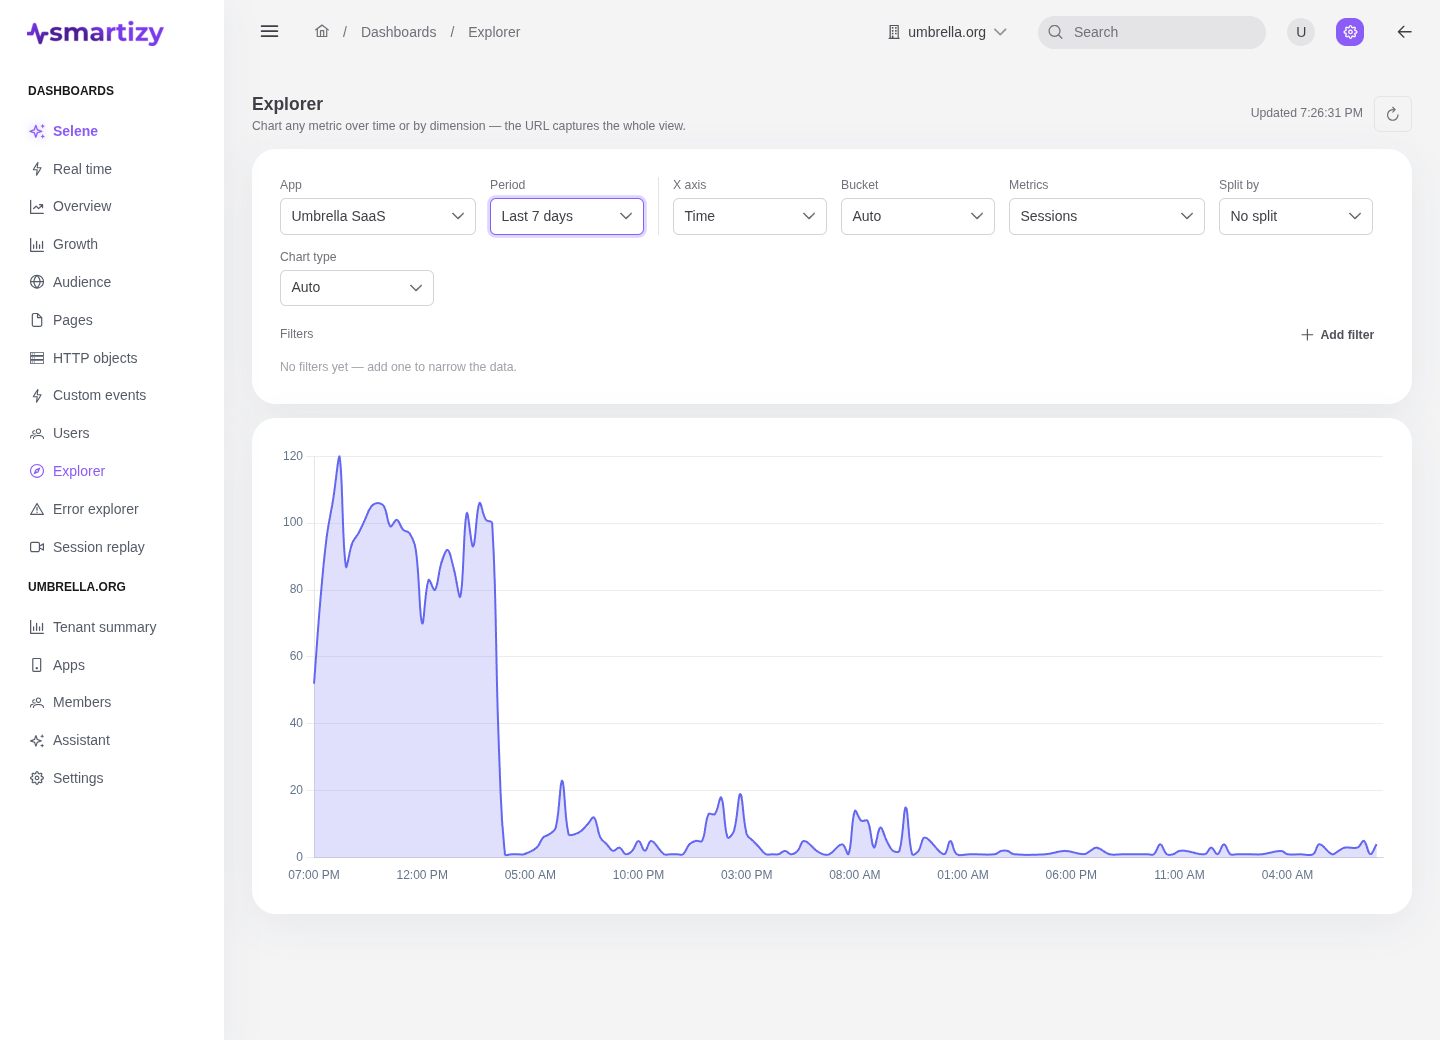
Build your own query. Explorer is a chart builder for the questions the fixed dashboards do not answer: pick the metrics, the axis, the split, and the filters, and it draws the chart. Every chart is a shareable link, so a finished view is one paste away from your team.
The other dashboards answer common questions out of the box. Explorer is the open-ended companion: a standalone, URL-driven builder where the entire state of the chart lives in the query string. Change a control and the URL updates; copy the URL and you have shared the exact chart.
What it answers #
- How does any metric trend over time, or break down by any dimension?
- How do two segments compare, side by side?
- What sessions sit behind a specific data point?
- How do I share an ad hoc analysis without a screenshot?
The controls #
Explorer carries its own controls rather than the shared scope bar, because every one of them is part of the shareable query:
| Control | What it does |
|---|---|
| App | The app to query. |
| Period | The time range to chart. |
| X axis | Either time, or a dimension to break down by (a categorical axis). |
| Bucket | The time granularity (hour or day) when the X axis is time. |
| Metrics | One or more series to plot: sessions, visitors, page views, bounce and error rates, Core Web Vitals, and more. |
| Split by | A dimension to draw one series per value, for side-by-side comparison. |
| Chart type | How to render the series. |
| Filters | Narrow the data by platform, environment, device, country, city, browser, OS, referrer, page, or release. |
Drilling into a point #
Click any point on the chart to open a drawer listing the sessions behind it. Explorer narrows the range to that point's bucket and folds in the clicked X and split values, so the list reconciles with the plotted number, and a notice shows how many of the total slice you are looking at.
Shareable deep links #
Because the whole query lives in the URL, Explorer is also where the deep links from other dashboards land. When you click through from a KPI or a chart elsewhere in Smartizy, you arrive at Explorer with the controls already set to reproduce that view, ready to tweak. Copy the URL to hand a colleague the exact chart, or bookmark it as a saved analysis.