Error explorer
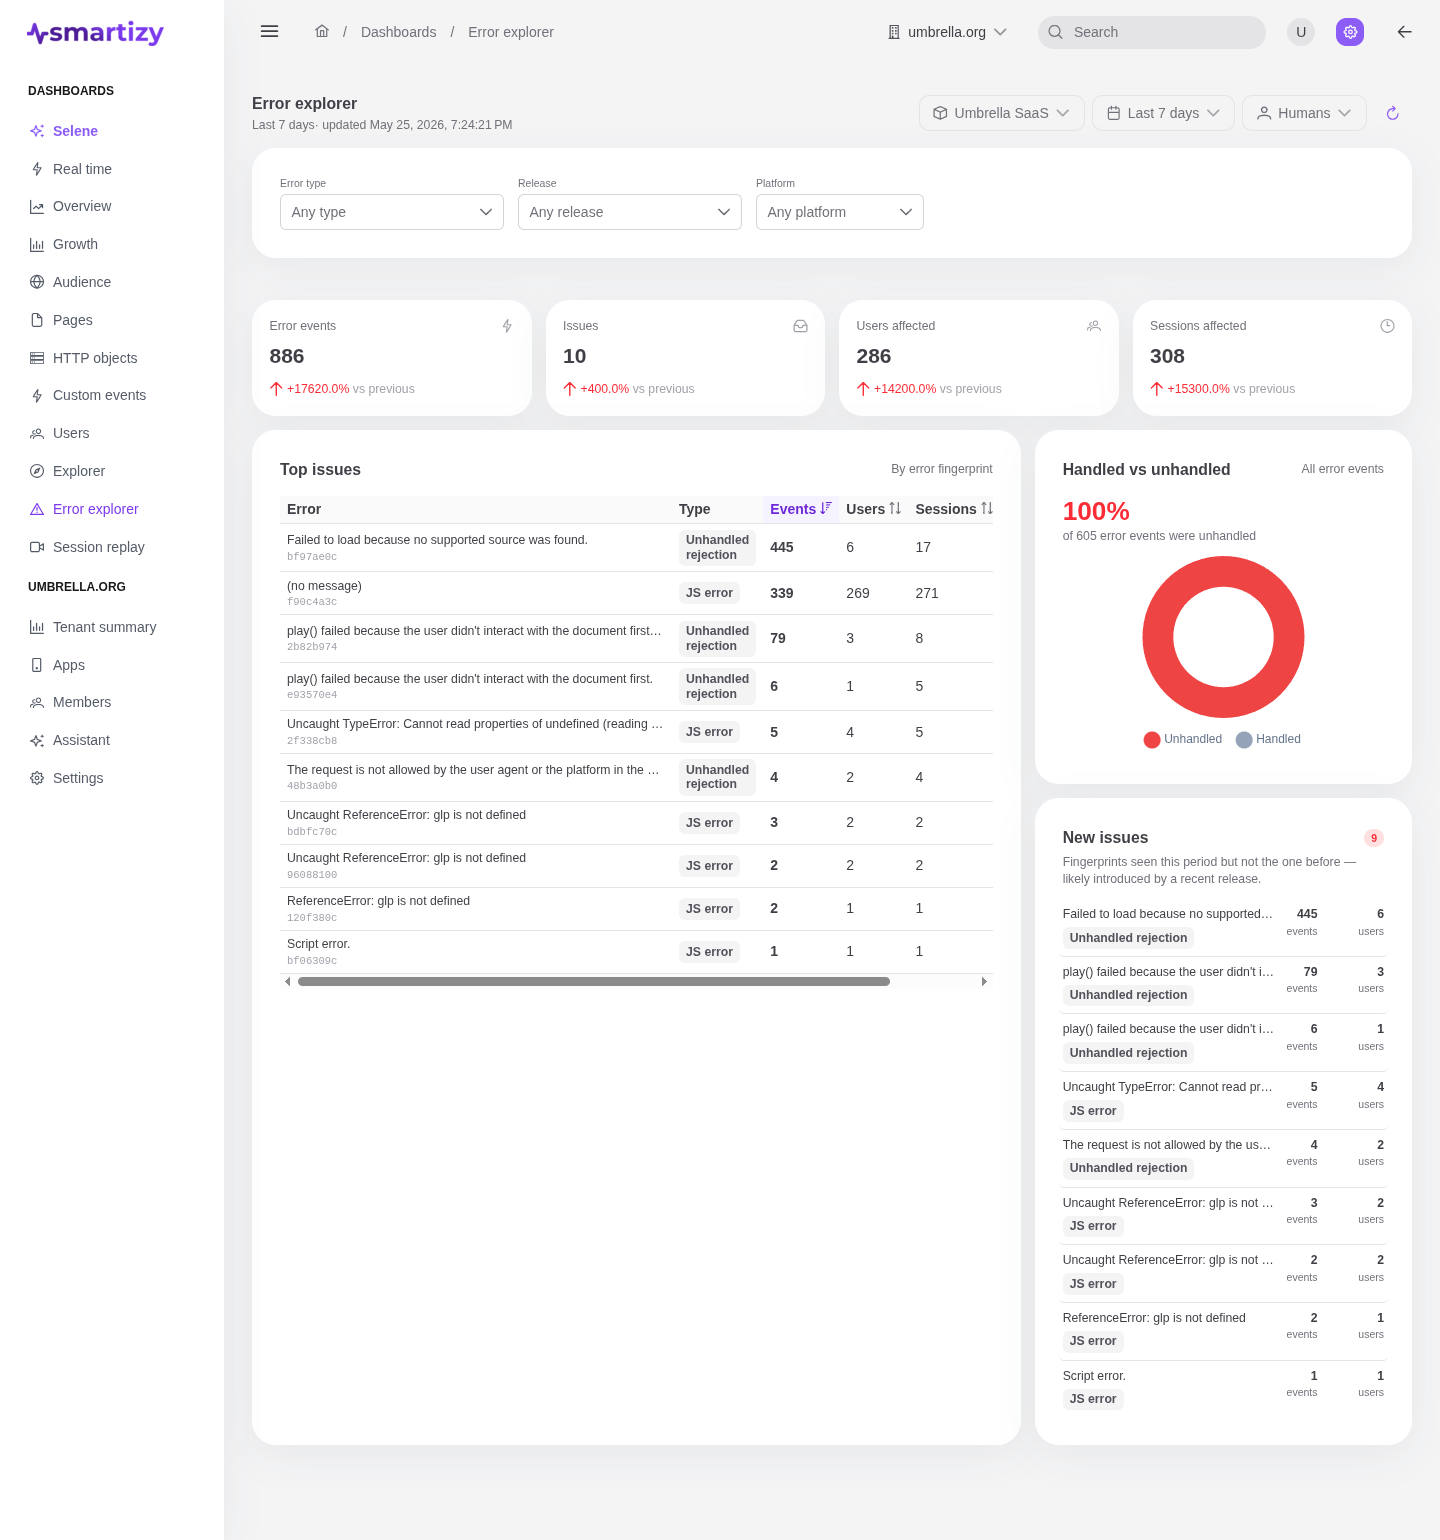
Find and triage the errors actually hurting your users. Error explorer groups raw exceptions into issues, ranks them by how many people they hit, and flags what is new since your last release, so you fix the things that matter first.
A noisy error log is hard to act on. This dashboard fingerprints errors into distinct issues, counts the users and sessions each one affects, and separates the regressions from the long-standing noise. Reliability work starts here.
What it answers #
- What are the worst errors right now, by user impact?
- What broke in the release I just shipped?
- Are these errors handled, or are they crashing the page?
- Where does a given error happen, and what does its stack look like?
Its own filter bar #
Error explorer still reads the app and period from the scope bar, but instead of the generic Filters drawer it has its own filter bar tuned for triage:
- Error type, to focus on one class of exception.
- Release, to scope every panel to a single deployed version.
- Platform, to separate web from other clients.
What you see #
The KPI strip leads with scale, each metric compared to the preceding equal-length window:
- Total errors, every error event in the period.
- Distinct issues, the number of unique fingerprints those events collapse into.
A top-issues list highlights the highest-impact fingerprints. The full issues table ranks them with a sample message and the counts that matter:
| Column | What it tells you |
|---|---|
| Error | A representative message sampled from the issue. |
| Type | The exception class or error type. |
| Events | How many times the issue occurred. |
| Users | Distinct users affected, the impact measure to rank by. |
| Sessions | Distinct sessions affected. |
| Last seen | The most recent day it occurred, to tell a live issue from a stale one. |
A handled vs unhandled split shows how many errors your code caught versus how many crashed unhandled. A rising unhandled share is a reliability red flag.
New issues and releases #
The new-issues panel diffs this period against the equal-length window before it and lists the fingerprints seen now but not then, the regressions. Set the Release filter and the diff scopes to that release, so you see exactly what a deploy introduced.
Issue detail #
Click any issue to open its detail drawer. It shows a representative message and full stack trace, the affected user and session counts, and the breakdown that makes it actionable: where the error happened, by page path and by browser. That tells you whether a bug is everywhere or confined to one route or one browser.