Audience
Who your visitors are and where they come from. Read it to size your markets and to know which devices and browsers your real users bring, so you test and build for the ones that matter.
Audience answers the demographic question: not how your app performs, but who is using it. It splits your traffic by geography and technology. It scopes to the app, period, audience, and filters in the scope bar.
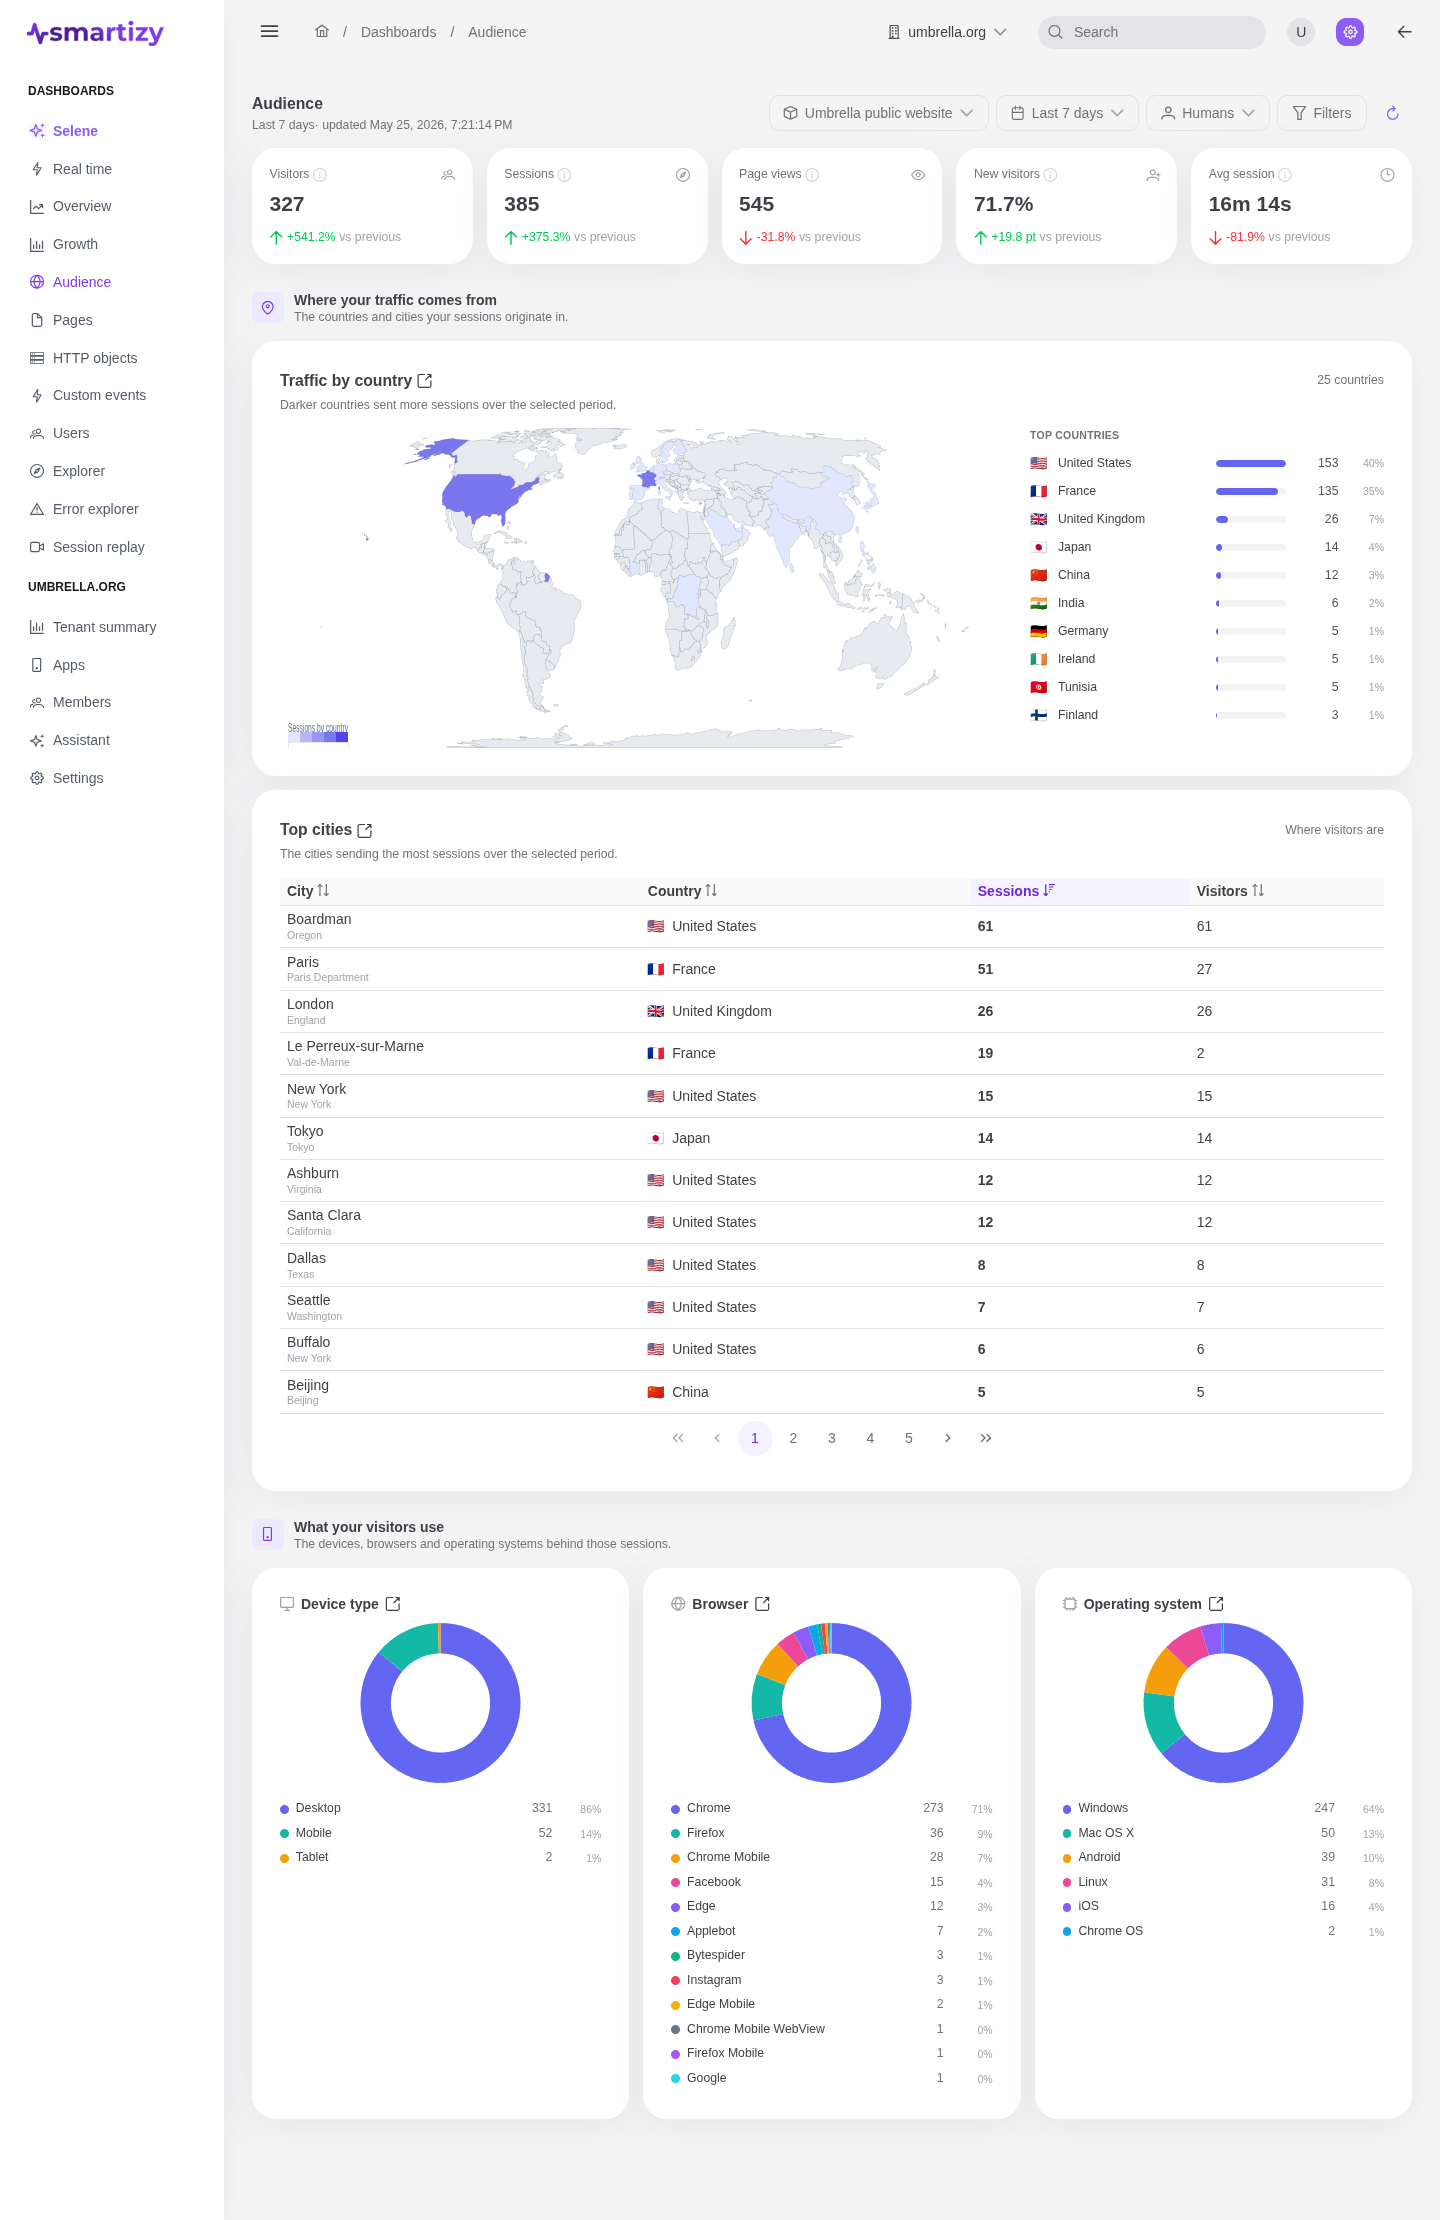
What it answers #
Where in the world are my visitors, and what are they using to reach me? The answer guides localisation, market focus, and the device and browser matrix you support.
The KPI strip #
Headline numbers, each compared to the previous equal-length period:
| KPI | What it measures |
|---|---|
| Visitors | Distinct people in the period. |
| Sessions | Distinct visits. |
| Page views | Total pages loaded. |
| Error rate | Share of sessions that hit an error. |
| Time on site | Average session duration. |
Where your traffic comes from #
Four panels map your audience geographically:
- A country geo map, shaded by session volume, for the shape of your reach at a glance.
- Top countries ranked by sessions.
- Top cities.
- A city table with city, country, sessions, and visitors, for precise comparison.
What your visitors use #
Three breakdowns describe the devices reaching your app:
- Device type: desktop, mobile, tablet.
- Browser.
- Operating system.
Use these to decide what to test against. If a browser carries real traffic but underperforms on Core Web Vitals, you have found a concrete fix worth its audience.
Related dashboards #
For how visitors arrived and which pages they landed on, see Growth. To watch the live geography of current traffic, see Real time.