Real time
What is happening on your site right now. Watch visitors arrive, pages load, and errors fire as they occur, the dashboard you keep open during a launch or a campaign.
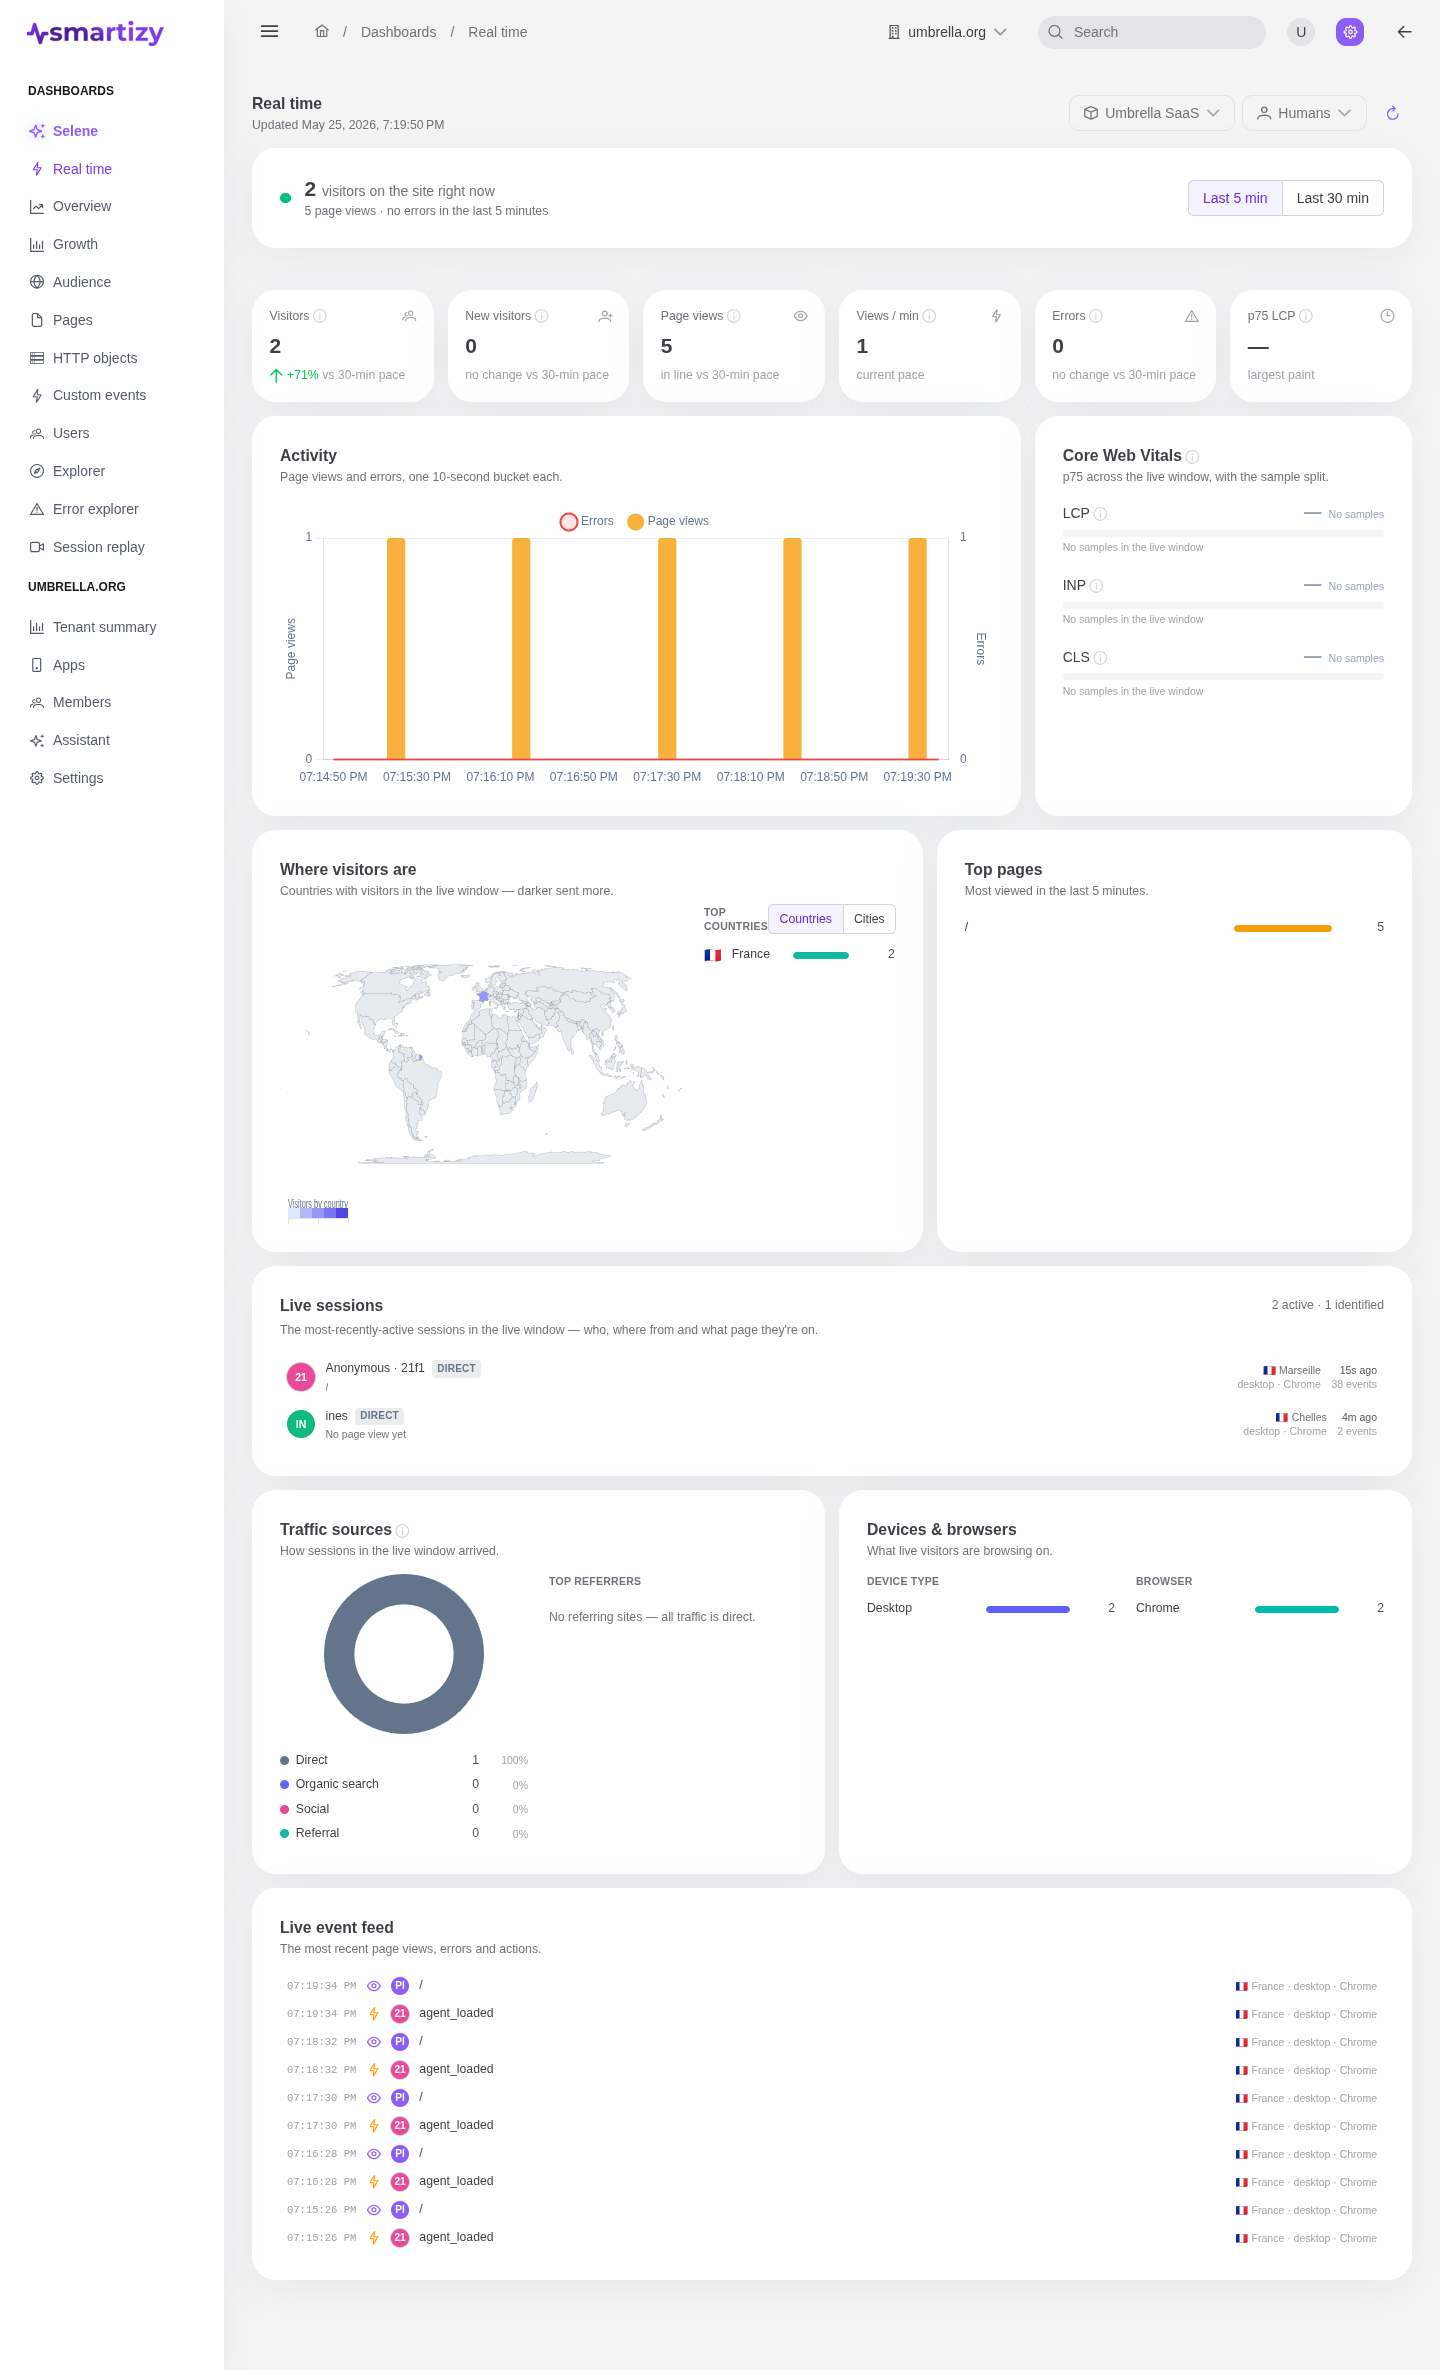
Real time is the live view. Where Overview summarises a period, this dashboard refreshes continuously and reports the last few minutes. It follows the app and audience set in the scope bar, but instead of a period it uses its own short live window.
What it answers #
Is traffic flowing right now, and is it healthy? Use it to confirm a release is taking traffic, to watch a marketing push land, or to catch a spike in errors the moment it starts.
Visitors right now #
A banner shows the count of visitors active this instant. A Last 5 min / Last 30 min toggle sets the live window every panel reads, a tighter window for a fast-moving launch, a wider one to smooth out the noise.
The KPI strip #
Headline numbers for the live window:
- Visitors and New visitors
- Page views and Views/min
- Errors
- p75 LCP, so you see load speed alongside volume
Live activity #
An activity chart plots traffic in 10-second buckets, fine enough to see a campaign email or a social post hit the second it does. Beside it, live Core Web Vitals track load and responsiveness for the same window, so a release that ships a regression shows up in speed, not just volume.
Where and who #
The live audience, broken out several ways:
- A geo map of active countries and cities.
- Top pages being viewed right now.
- Traffic sources and top referrers sending visitors in.
- Devices and browsers in use.
Live sessions and events #
Two streams put faces to the numbers. The live sessions list shows individual visits in progress, and the live event feed scrolls events as the receiver records them. Together they let you watch a single visitor move through the site in close to real time.
When to use it #
Real time is for the moment. For trends over hours or days, read the Overview. To understand where live traffic is coming from over time, see Growth.