Introduction
Smartizy is Real User Monitoring for the web. It shows you how real people actually experience your site, measured in their own browsers, not guessed from synthetic tests or sampled traffic.
Every page load reports back: how fast it felt, whether anything broke, where the visitor came from, and what they did next. Smartizy turns that stream into dashboards for speed, reliability, and growth, so you can answer "is the site fast and working for the people on it right now?" with evidence instead of opinion.
What you get #
One snippet feeds five things at once:
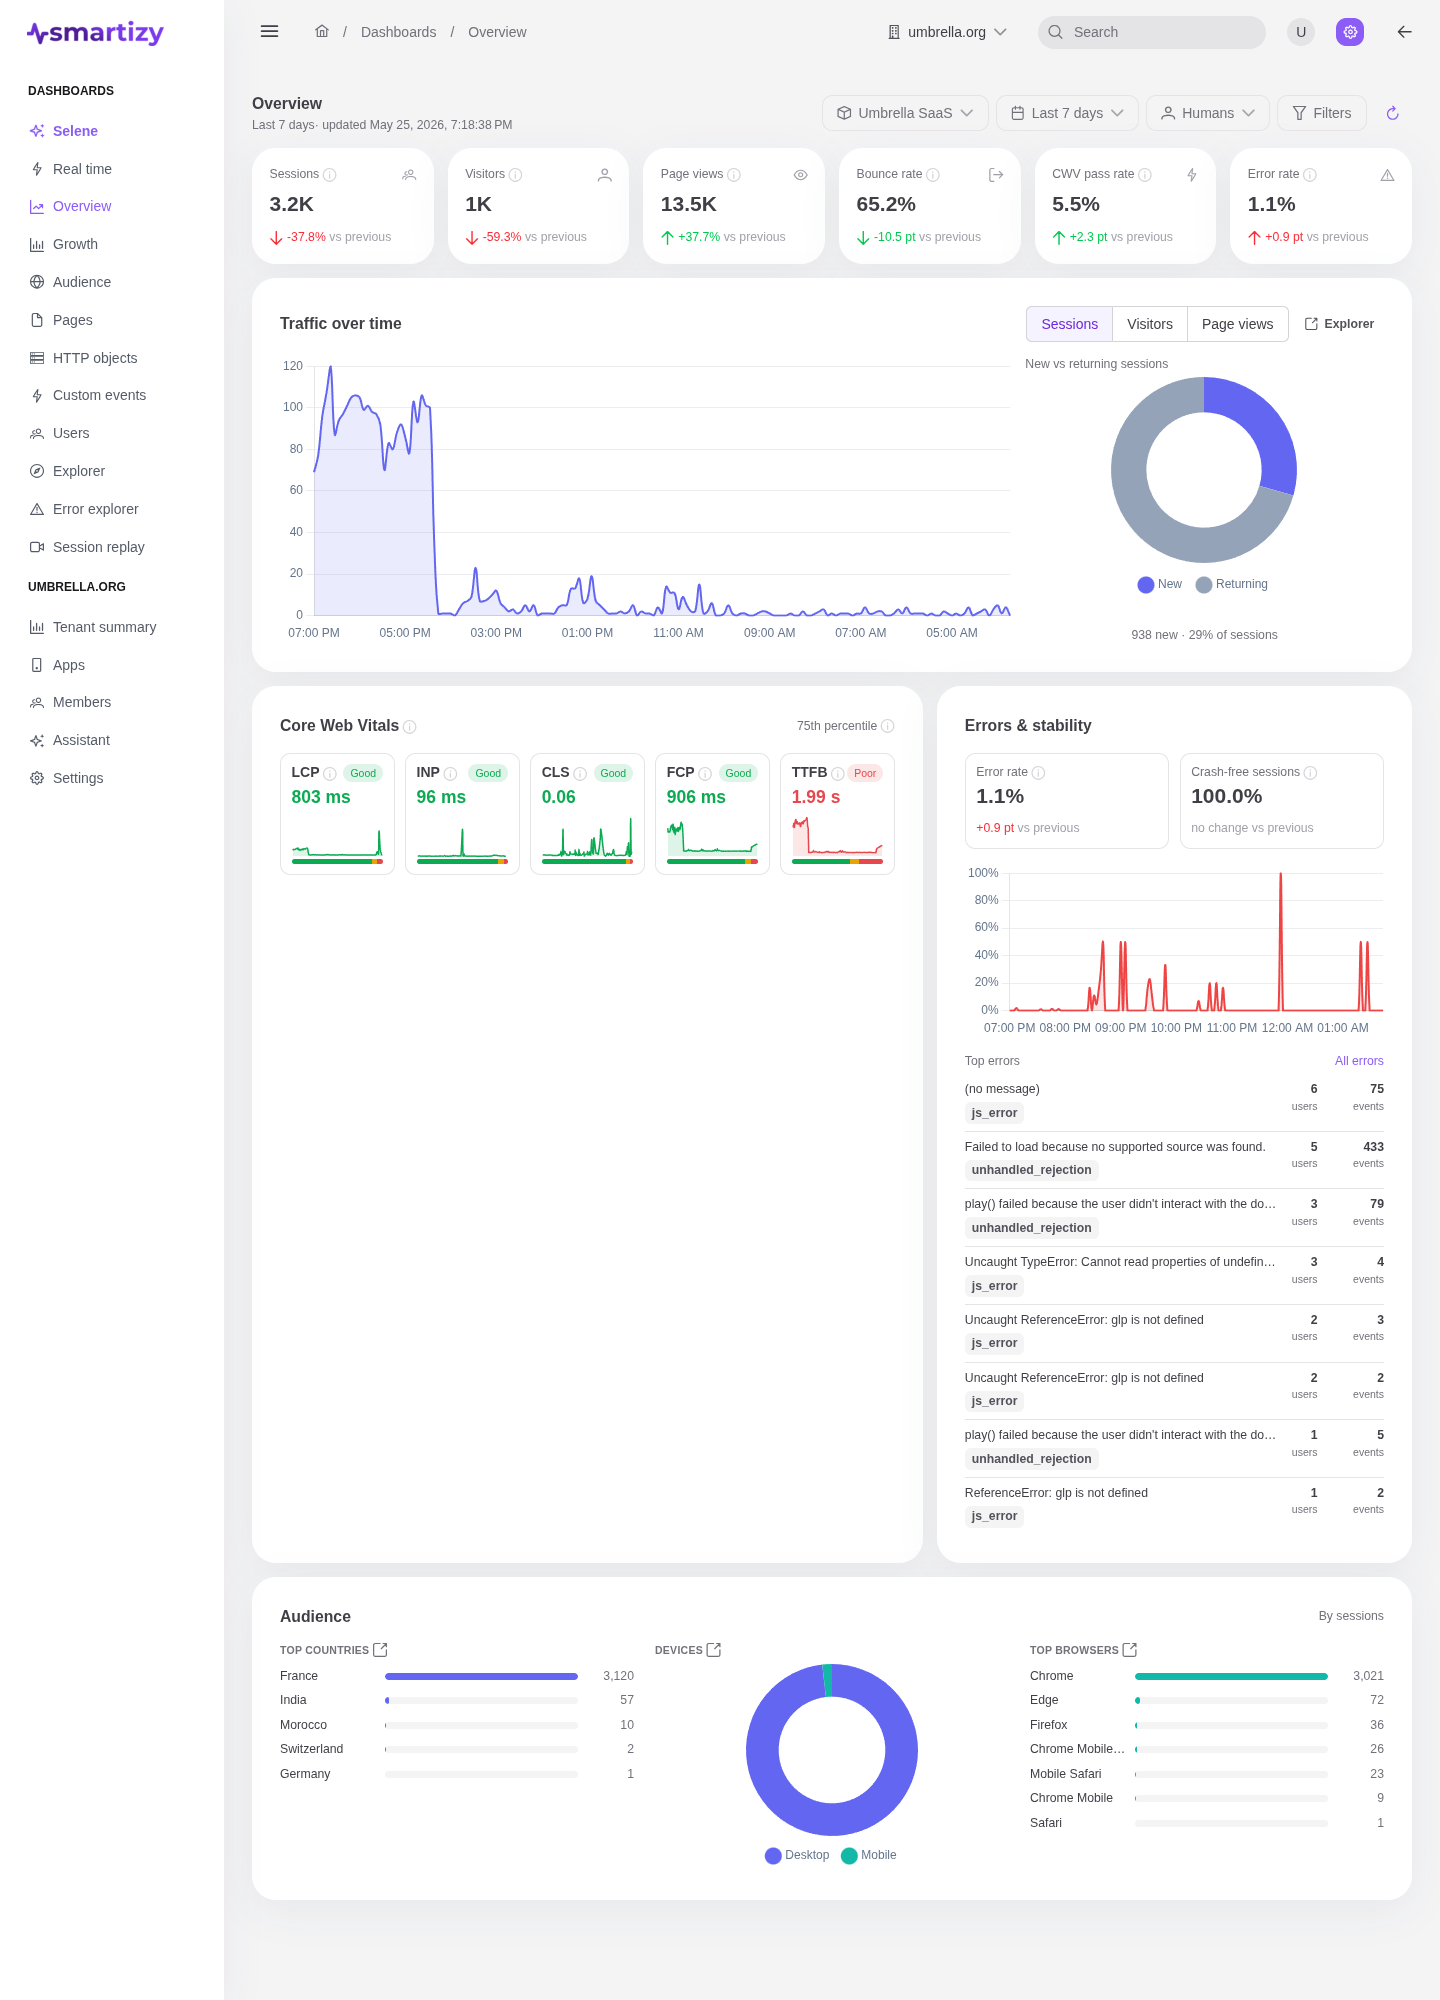
- Performance. Core Web Vitals (LCP, INP, CLS) and navigation timing from real sessions, broken down by page, device, country, and release, so you see the experience your actual audience gets, not a lab score.
- Reliability. Unhandled errors and rejections are captured automatically, grouped into fingerprints, and tracked over time. Crash-free rates and new-issue alerts tell you when a deploy made things worse.
- Growth and audience analytics. Acquisition channels, landing pages, geography, and technology, plus the journeys visitors take through your product. See who shows up and what converts.
- Session replay. Reconstruct a real session to watch what a user saw and did, with privacy controls so sensitive fields stay masked.
- Selene, your AI analyst. Ask questions in plain language. Selene reads your data, runs the queries, and answers with charts and an explanation, so you do not have to build a report to get an answer.
How it works #
The pipeline is short and the only thing you touch is the first step. Everything after it runs for you, whether you use the hosted service or self-host the stack.
A one-line script runs in the browser
You drop a small snippet into your site's <head>. It loads the collector,
which measures each session and sends compact beacons as the visitor browses.
The ingest receiver validates and enriches each beacon
Beacons arrive at the ingest endpoint, which authenticates the app, applies its policy (sampling, rate caps, allowed origins), adds geo and device detail, and drops bots and noise before anything is stored.
A column store keeps the events and rolls them up
Accepted events land in a column-oriented analytics store built for fast aggregation over billions of rows. Hourly and daily rollups keep the common questions instant.
Dashboards and Selene read from it
The console queries that store to render every dashboard, and Selene queries it to answer your questions. Same data, two ways to read it.
Two ways to run it #
Pick the track that fits how you want to operate. The SDK and dashboards are identical either way.
| Track | Best when | Start here |
|---|---|---|
| Use the hosted service | You want to be collecting data in minutes, with no infrastructure to run. | Quickstart, then Install the snippet |
| Self-host the stack | You need the data to stay in your own environment, on your own infrastructure. | Self-host overview |
New here? The fastest path is the Quickstart: create an app, paste one snippet, and watch events arrive in about five minutes. If you want the vocabulary first, read Core concepts.