HTTP objects
See how every network request your pages make actually behaves in the field: your own assets, your APIs, and the third parties you embed. HTTP objects turns the browser's resource-timing data into a host-by-host view so you can pin down what is slow, what is failing, and which vendor is to blame.
Every visit fires off dozens of requests for scripts, stylesheets, images, fonts, and API calls. When a page feels sluggish or a feature breaks, the cause is often one of those requests, not your HTML. This dashboard ranks them by host so a single slow analytics tag or a failing CDN stands out immediately.
What it answers #
- Which third-party hosts are slowing my pages down?
- Are any requests failing, and from where?
- How much weight (bytes) is each host adding to a page?
- What did the network look like during one specific user's session?
What you see #
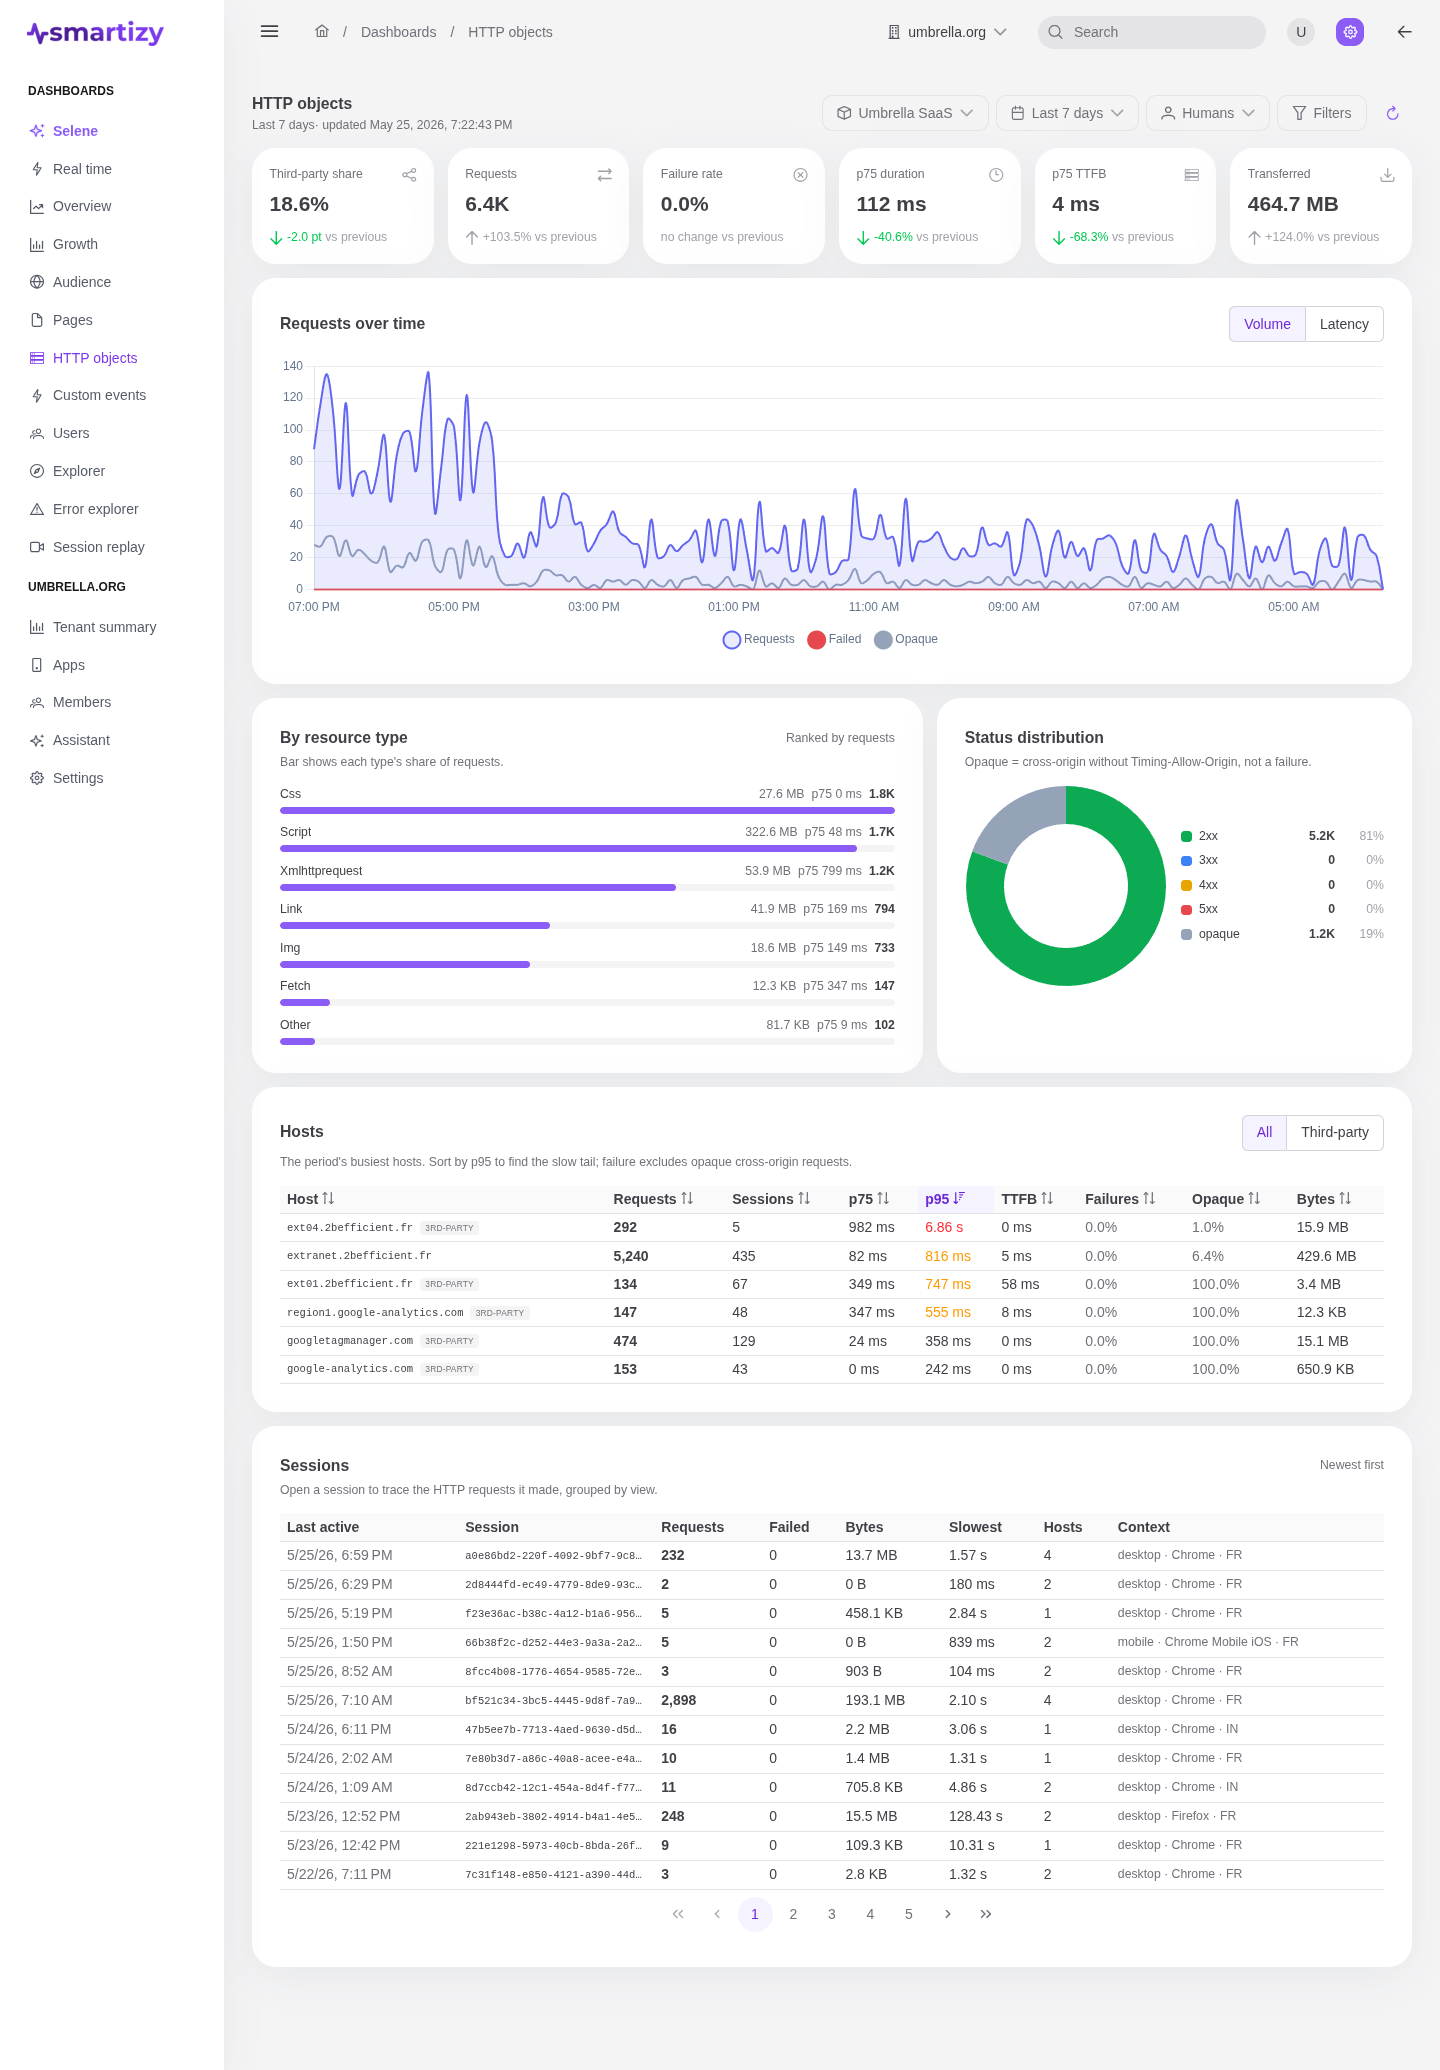
The dashboard reads the app, period, audience, and filters from the scope bar at the top. Below it sits a KPI strip with the period's headline numbers, each compared to the preceding equal-length window:
- Failure rate, the share of status-observable requests that returned an error (status 400 or above).
- Requests, the total resource requests captured.
- Opaque %, the share of cross-origin requests that returned no timing data (no
Timing-Allow-Originheader). - p75 duration, the request duration most of your users beat.
- TTFB, the p75 time to first byte.
- Bytes, the total transferred weight.
Three charts break the volume down:
- A requests-over-time chart, with failures and opaque requests overlaid so a spike in either is obvious.
- A by-resource-type breakdown across
css,script,xmlhttprequest,link,img,fetch, andother, each with its own failure rate and weight. - A status distribution donut splitting requests across the 2xx, 3xx, 4xx, 5xx, and opaque classes.
The hosts table #
The hosts table is the centerpiece. It ranks every host your pages talked to by request volume, so the worst offenders sit at the top. Each row carries:
| Column | What it tells you |
|---|---|
| Host | The hostname, flagged as first-party or third-party depending on whether it matches the loading page. |
| Requests | How many requests went to this host. |
| Sessions | How many distinct sessions touched it, so you can tell a broad dependency from a rare one. |
| p75 / p95 | The duration percentiles, the honest measure of how slow this host is for real users. |
| TTFB | Time to first byte, isolating server latency from transfer time. |
| Failures | The failure rate for this host alone. |
| Opaque | The share of opaque (no-timing) requests, common for ad and analytics vendors. |
| Bytes | The transferred weight this host adds. |
Sort by p95 to find the slowest dependency, or by failures to find a flaky one. A third-party host with high latency and broad session reach is a strong candidate for lazy-loading or removal.
Sessions and the waterfall #
Aggregates tell you which host is slow; the sessions table tells you what one user lived through. It lists the period's most recently active sessions that made requests, each summarised by last active time, session, requests, failed, bytes, slowest request, and hosts touched.
Open a row to drop into a per-session waterfall. It groups every request by the view that issued it, orders views by first activity, and renders each request as a phase-segmented bar (DNS, connect, TTFB, download) scaled to the slowest request in the session.