Growth
Marketing analytics for your public site. See where visitors come from, which pages win them, and why they leave, so you can put effort where it returns.
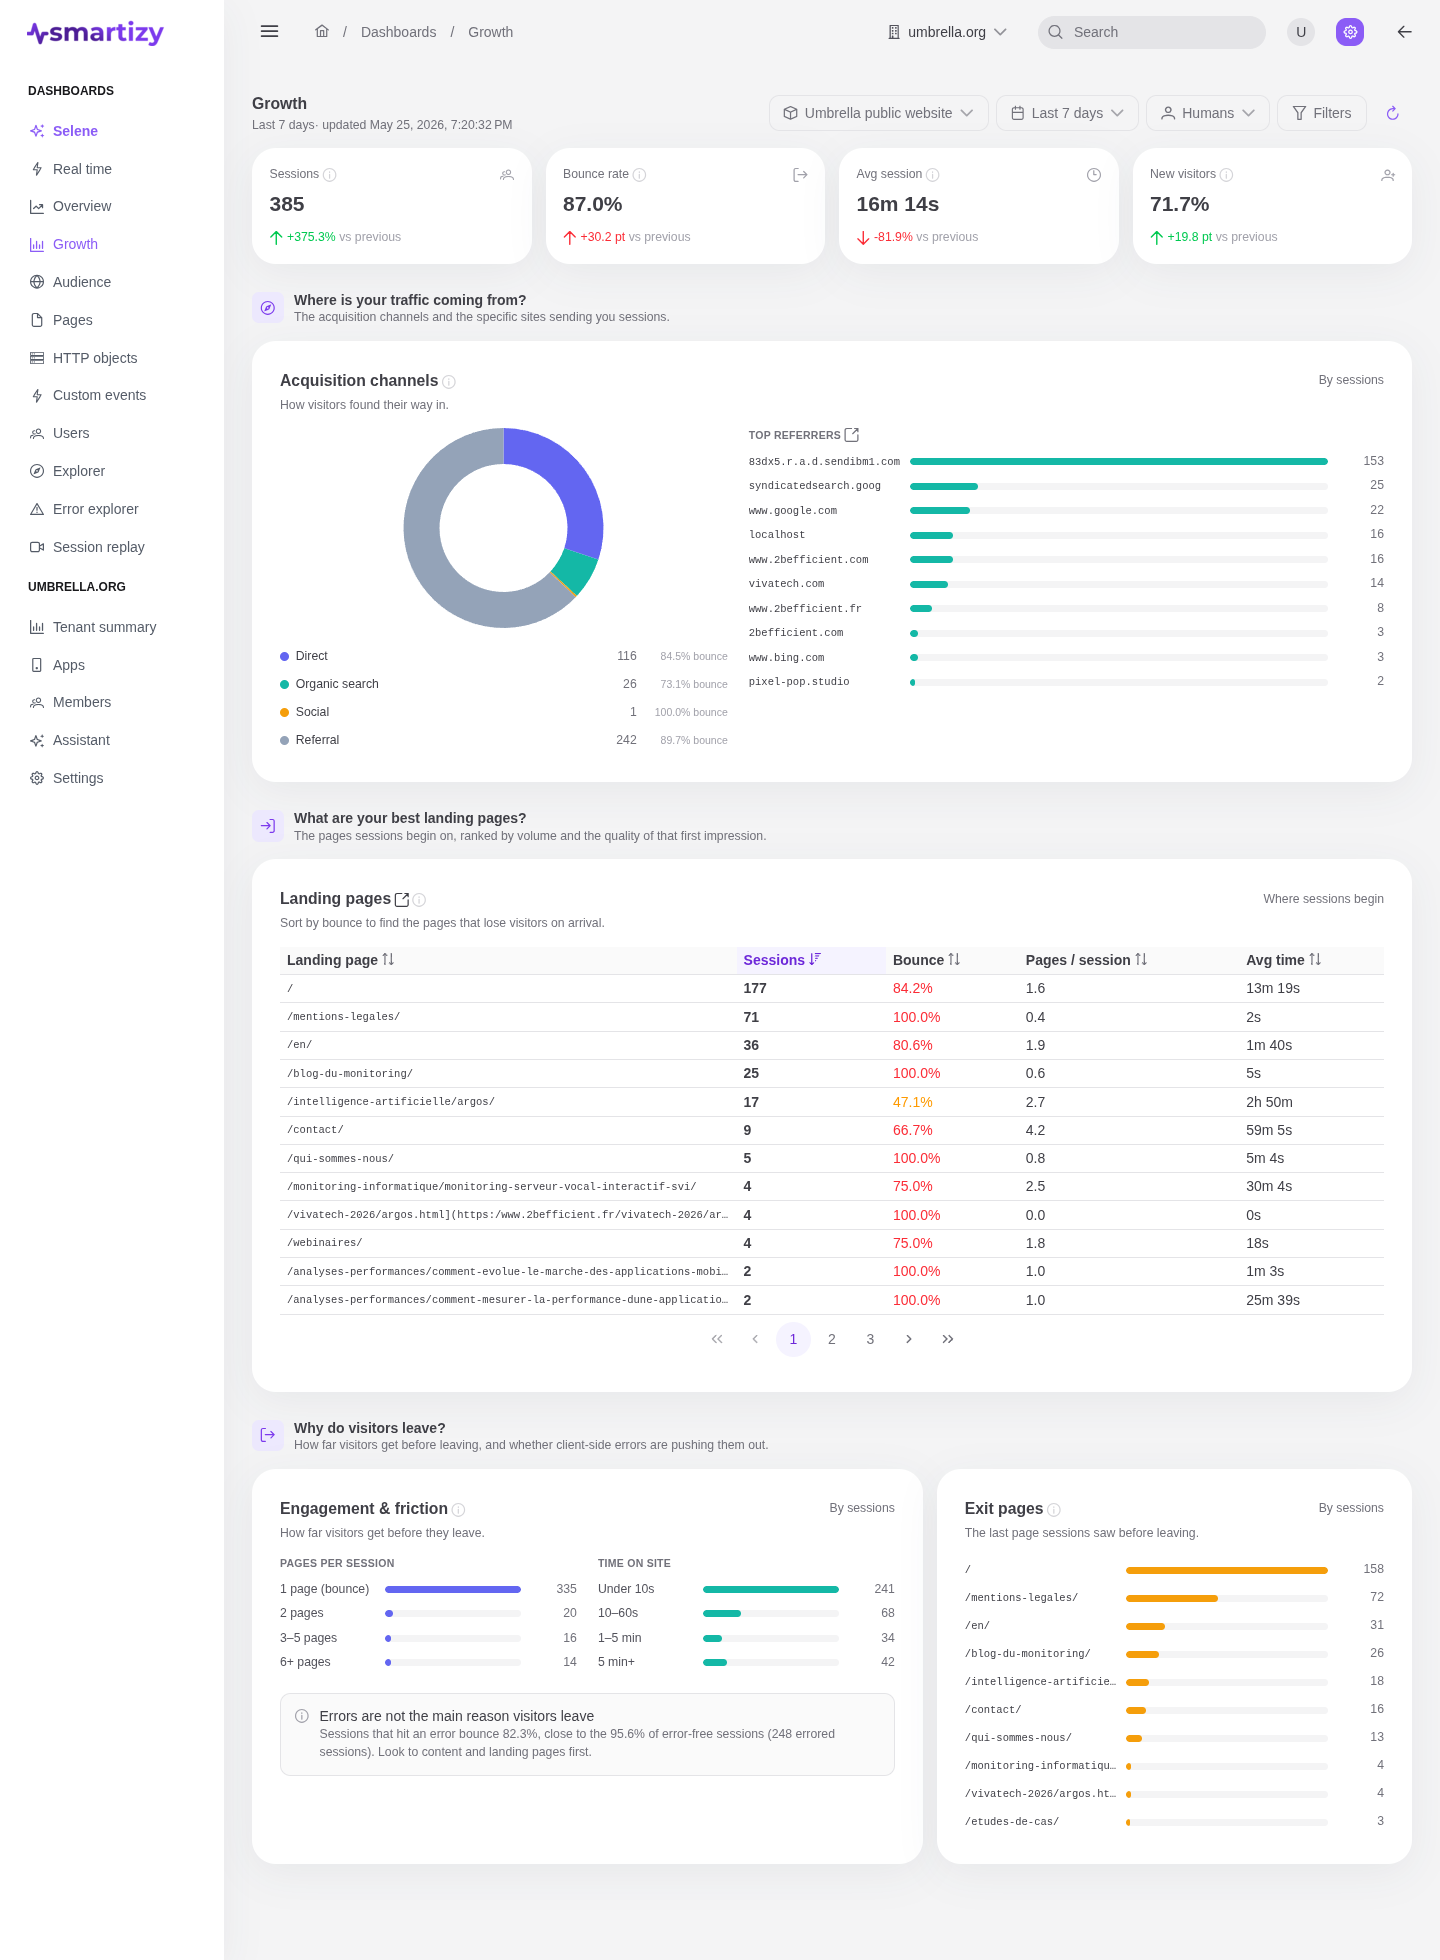
Growth is the dashboard to read for a marketing site. It is built around three questions a growth team asks every week, and it answers each from the session data your visitors already produce. It scopes to the app, period, audience, and filters in the scope bar.
The worked example throughout is the Umbrella public website, a marketing site with anonymous traffic arriving from search, social, and referrals.
What it answers #
Three questions, one per section:
- Where is your traffic coming from?
- What are your best landing pages?
- Why do visitors leave?
The KPI strip #
Headline numbers, each compared to the previous equal-length period:
| KPI | What it measures |
|---|---|
| Sessions | Distinct visits in the period. |
| Bounce rate | Share of sessions that left after a single page. |
| Time on site | Average session duration. |
| Error rate | Share of sessions that hit an error. |
Where is your traffic coming from? #
Smartizy classifies each session's referrer into an acquisition channel, so you can read your traffic mix without tagging links:
- Direct: no referrer, typed URLs, and bookmarks.
- Organic search: arrivals from search engines.
- Social: arrivals from social platforms.
- Referral: links from other sites.
Each channel carries its own bounce and new-visitor rates, so you can tell quality apart from volume. A top referrers list names the specific sites sending traffic.
What are your best landing pages? #
A landing page is the first page of a session, the one that has to earn the visitor's attention. The landing-pages table ranks them so you can see which entry points convert interest into engagement:
| Column | What it tells you |
|---|---|
| Landing page | The page sessions started on. |
| Sessions | How much traffic it draws. |
| Bounce | How often visitors leave straight away. |
| Pages/session | How far visitors go after landing. |
| Avg time | How long they stay. |
Why do visitors leave? #
This section reads engagement and friction together. Pages per session and time on site show how deeply visitors engage, and an exit pages list shows where sessions most often end, the pages losing people. Read a frequent exit page against its speed and errors to tell a natural finish line from a leak.
Related dashboards #
For who your visitors are and where in the world they sit, see Audience. For the performance of a single page that appears here, open Pages.